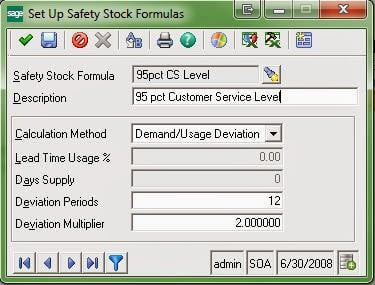
There are some important points to note in using "Deviation" formulas in Sage 500 ERP to calculate Safety Stock. First of all, the "Demand/Usage Deviations" used by Sage 500 ERP are the differences between your "Forecast Demand" and your "Actual Demand,” and not deviations in actual demand from the mean of actual demand/usage. Also, your "Forecast Demand" may include data that could skew the results (e.g., poorly estimated Demand Adjustments).

Another important point to be noted is that any differences where "Forecast Demand" exceeds "Actual Demand" in any given period are omitted from the averaging process, so negative variations are not considered at all. (I assume that Sage took this approach because they do not use squared values -- as the statistical standard deviation formula does -- which would eliminate negatives, and also, perhaps because the designers and developers deemed that if your Forecast exceeds your Actual Demand, you have covered your requirements.)
Note that a statistical "Standard Deviation" for a sample or population (in this case, one would use the sample formula) is calculated on the variance from the statistical mean of the sample data, so the Sage 500 "Deviation" is not a "Standard Deviation" in "Actual Demand." The result is that setting your "Multiplier" to the value of 2.0000 does not necessarily cover 2 standard deviations in actual demand. This is meant to cover over the failures in forecasting actual demand.
Sage 500 Simulation
I set up a simulation to compare the results between the Sage 500 "Deviation" formula to calculate Safety Stock and a true standard deviation in "Actual Demand." In my particular simulation (with a look-back over 12 inventory periods), I found that the Sage 500 formula was slightly more conservative -- tending to estimate below the value suggested by the standard deviation in "Actual Demand" more often than not.
In general I would say that the Sage 500 formula approximates coverage of the multiplier number of standard deviations in actual demand, but it is not precise. Much would depend on the set of data against which the calculations are run and this, of course, means that the results will vary for each Item in a Sage 500 company's inventory.
It may have been helpful if Sage 500 had employed standard deviations against actual demand so that, for example, when one selected 2.000 for a multiplier, one could assert that you are setting a 95.45% confidence level on customer service for Items that employ that particular Safety Stock Formula (in accordance with the following chart).
CONFIDENCE INTERVAL FACTORS for Various Multiples of Standard Deviations (σ):
zσ = Percentage
=========================
1σ = 68.27%
1.645σ = 90%
1.960σ = 95%
2σ = 95.450%
2.576σ = 99%
3σ = 99.7300%
3.2906σ = 99.9%
4σ = 99.993666%
5σ = 99.99994267%
6σ = 99.9999998027%
7σ = 99.9999999997440%
=========================
If you have further comments or questions, please feel free to contact us directly, or leave your comments here.


