Using Extended Events to Performance Tune Sage 500 - Part 3
Running the XE Session and Brief View of Events
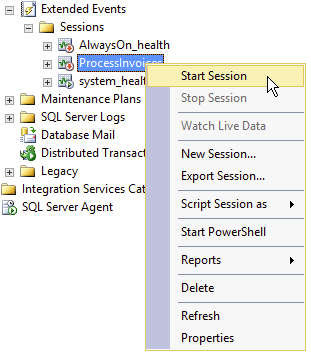
Running the XE Session is super straight forward. Just right-click on the ProcessInvoices session in the object browser and click Start Session for SQL Server to start recording events in memory and transferring them asynchronously to the event file about every 30 seconds.
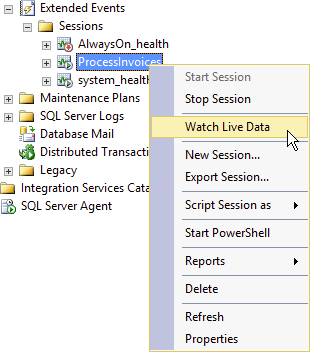
I use the Extended Events Viewer by right-clicking again on the ProcessInvoices session and selecting Watch Live Data. If you are used to Profiler, the data coming in may seem a little latent because it is. It is getting the data asynchronously, which is good. It is just not quite as smooth as you are used to with profiler.
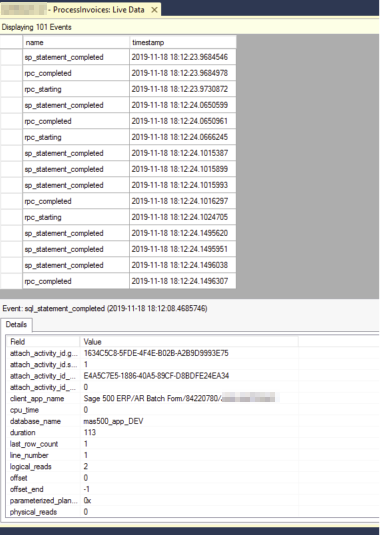
The Extended Events Viewer has a grid and detail layout. Again, if you are used to profiler it is a bit disconcerting because the grid by default shows only the event name and the timestamp of the event. You have to click on the event to get the details to show up in the section below. However, you can choose the columns that you want to show in the grid. Just right-click on the field in the Details section and click Show Column in Table from the context menu.
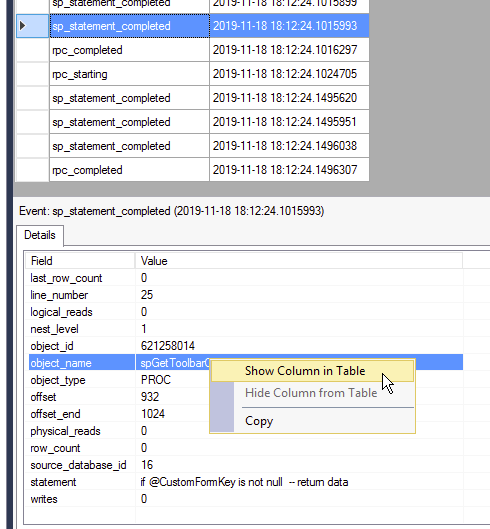
When performance troubleshooting and doing the brief view of the data I typically show the object_name, statement, duration, attach_activity_id.guid, and attach_activity_id.seq. For the events that I have selected, the duration is in microseconds. Each event can have different units for the duration column. This Stack Exchange post provides a query to determine the duration for each extended event. Causality Tracking provides the attach_activity_id.guid and attach_activity_id.seq fields. The GUID is created with the first event recorded in a call stack, which is why I add the rpc_starting event to provide the starting GUID. Each event recorded in a call stack will have an incremented sequence number which helps see the flow of code through the entire event.

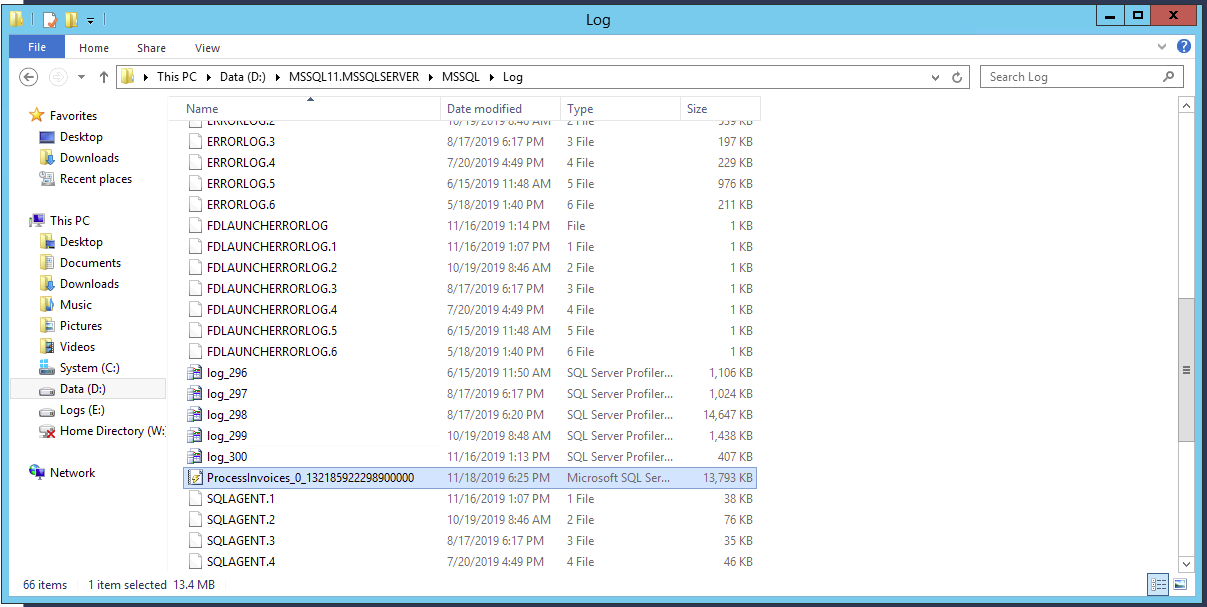
Once you have captured the desired events, you can right-click on the ProcessInvoices session and select Stop Session to stop the capture. You will find the *.xel file located in the directory specified when the XE Session was created.
More in this Troubleshooting series (available as they are published)
Parsing an Extended Event Attach_Activity_ID into Component Parts with the String_Split Function
Using Extended Events to Performance Tune Sage 500 - Overview
Identifying the Sage 500 Task Name as seen in SQL Server
Running the XE Session and Brief View of Events
GOT QUESTIONS ABOUT Sage 500 ERP?
Contact us if you have more questions about your Sage 500 solution >> Contact RKL eSolutions


