"Every at-bat is like a game of blackjack. Every card that's dealt changes the odds." So says Paul Brand, the character inspired by Paul DePodesta in the movie "Moneyball."
The people who count cards at the blackjack table are generally unwelcome in Las Vegas and casinos everywhere.
Why?
Because, being able to understand the changing odds of success or failure—winning or losing—in near real time swings the odds in favor of the bettor, and the casino is more likely to lose.
The odds of winning are constantly changing
I cannot tell you the number of companies with which we have come into contact whose inventory or supply chain folks will tell us something like, "We have this Excel workbook we use. We have it set up so that we try to keep about 6 [or 10, or 16, or some other number] weeks of inventory on-hand."
Frequently, they will go on to describe a process something along these lines: "Every week, we start by looking at our current inventory position and comparing it SKU-by-SKU with our target inventory position. To do this, we use this report and that report. If we have any questions about the numbers, we will check with the warehouse, if necessary. From this, we put together our replenishment orders and figure out if there are any expediting actions we need to take, too."
Here's the problem.
The odds of your supply chain winning (read: successfully satisfying demand) change with "every card that is dealt"—that is, with every moment that passes and every new actual demand transaction that occurs in the system.
Most supply chains fail to provide unambiguous signals for action
As the odds of "success" change across most supply chains—whether you consider your supply chain as merely within your four walls, or if you receive near real-time feedback from your extended supply chain—the decision-makers generally fail to receive crystal clear, unambiguous action signals about those changing odds.
The signals may be there, but they are buried in multiple ERP screens and a half-dozen reports. Furthermore, it may take hours to put all the pieces together. Even then, six different managers looking at the data may not be able to agree on the priorities to assign to the actions indicated.
Along comes Demand Driven MRP
With DDMRP, all of this changes.
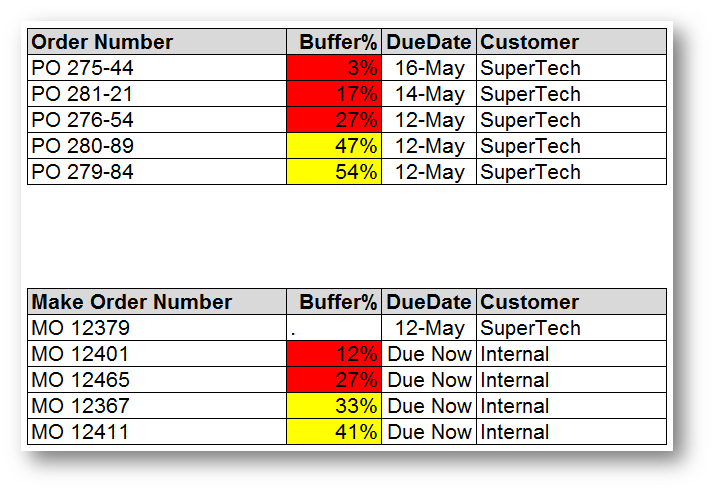
Imagine a simple dashboard that gives your supply chain team clear signals about the changing odds of "success" in the system in a very simple, straightforward way: a COLOR CODE and one simple NUMBER.

In the accompanying figure, it is very easy to see priorities. RED is acted on before YELLOW; YELLOW is acted on before GREEN. And, the PERCENT of BUFFER remaining clearly indicates the level of criticality within any color segment.
What kind of success might be expected with DDMRP?
In a conscientiously applied program of DDMRP, "success" rates typically climb into the high 90s in terms of on-time order fulfillment rates. That would be great for many companies if that were the only advantage. But it's not.
While "success" rates are rising, DDMRP is simultaneously leading to lower inventory levels. Indeed, 30 or 40 percent reductions in inventory are not uncommon.
If you would like to know more, let us know. Leave your comments here, or feel free to contact us directly. We would be delighted to help you improve your odds of success, while liberating cash and increasing your ROI at the same time.
Click below to subscribe and have this blog series sent straight to your inbox!
Subscribe to the Blog Series


