In an earlier article, we covered an approach for setting beginning stock buffer levels in your inventory based on “inherent simplicity.” But that just gets you started. Stock buffer levels are not a set-and-forget matter. Inventory buffer levels should be managed and, in my opinion, not on a once-a-year basis or even once-a-quarter, but buffers levels should be managed constantly and dynamically.
In this article, we will discuss how to manage inventory buffers on a dynamic and ongoing basis.

Dynamic Buffer Management
Dynamic Buffer Management (DBM) for inventory is a forward-looking process that is constantly assessing the two critical factors that should determine the size of the buffer for any given SKUL (SKU-location):
- Changes in demand
- Variability in supply
Dynamic Buffer Management does this, not with complex statistical formulas, but using a method that is inherently simple. DBM dynamically adjusts the size of each SKUL buffer and provides replenishment priorities by monitoring the actual consumption and status of the buffer. (This stands in apposition to the methods that statistically monitor other factors such as demand and lead time.)
The goal of dynamic buffer management is to provide supply chain managers with a way understand how effectively their supply chain is functioning for each SKUL, but to supply this information using “inherent simplicity” as the basis. This allows virtually anyone, with little or no training, to immediately comprehend where management attention and action should be directed.
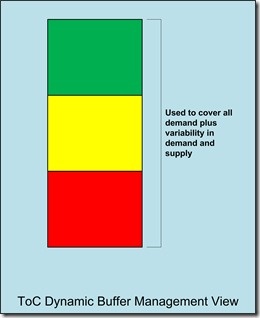
Dynamic Buffer Management helps management address inventory management and supply chain issues proactively by identifying and highlighting problems earlier than most other methods. And, DBM identifies and highlights supply chain UDEs (undesirable effects) using symbologies that virtually everyone recognizes and understands: green, yellow and red color codes to stand for ‘OK’, ‘Warning’ and ‘Danger’ or ‘Urgent.’
By providing an early warning system, DBM provides signals that help management take appropriate steps at the appropriate time. It even provides a method for prioritizing attention over dozens, hundreds or even thousands of SKULs that may need to be managed.
Each of the following dynamics affect inventory stocking levels on an ongoing basis:
- Changes in order lead time (OLT)
- Changes in production lead time (PLT)
- Changes in transportation lead time (TLT)
- Changes in consumer demand
- Special offers, promotions or sales incentives
- Changes in the market—perhaps the firm has just opened new sales territories or entered into new markets
- Customers are gained or lost
- New products or product lines are introduced or old products are phased out
Each of these actions could lead to changes in buffer levels, but it is a difficult complex statistical system to model what those changes might be or the effect those changes should trigger in the buffer size. Some controllable SDCs (Sudden Demand Changes), such as those triggered by opening a new sales territory or short-term sales promotions must be managed proactively by supply chain and inventory managers. They cannot be automatically anticipated by any automation, no matter how clever. (For most software companies, their “Clairvoyance Module” is still in development and will not see the light of day in our lifetimes.)
For Dynamic Buffer Management to have its greatest effect and success for any firm, the supply chain executives and managers should have in place or be working towards the following:
- Replenishment orders are placed daily—or, if not daily, at least at regular intervals (rather than randomly or on-demand) and the intervals are as short as is feasible for each SKUL
- Minimum order quantities have been (or are being) replaced by long-term pricing agreements based on aggregate purchases over time and not on an order-by-order basis
- Maximum Stock Level (the buffer size) has replaced other stock management methods for those items subject to DBM
- Reorder points (ROPs) are no longer enforced, since order sizes are no longer driven by minimum order quantities
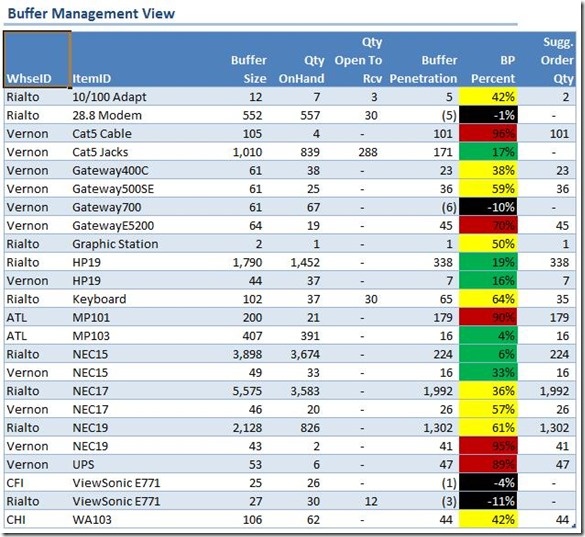
If you do not have too many SKULs to manage, you may be able to get a pretty good view of your buffer statuses and drive replenishment using nothing more than a spreadsheet (e.g., Microsoft Excel) connected to your inventory data.

In the example attached, one can easily see the red, yellow and green color-coding at work. (Note: The black color-code indicates an overstock condition.)
This simple spreadsheet calculates the BP (Buffer Penetration) as:
Buffer Size LESS Qty OnHand
And, it calculates the BP Percent as:
Buffer Penetration DIVIDED BY Buffer Size
When the BP percent is 33 percent of less, then the buffer is in GREEN status. Everything is okay.
When the BP percent is more than 33 percent but less than 67 percent, then the buffer is in YELLOW status. These SKULs need to be monitored for excess demand or replenishment delays, but no corrective action is needed where nothing out of the ordinary is found or anticipated.
When the BP percent is 67 percent or more, then the buffer status is reported as RED and appropriate corrective action should be taken.
Note that the suggested replenishment order (Sugg. Order Qty) is always calculated as:
Buffer Size LESS Qty OnHand LESS Qty Open to Rcv (open POs)
How to Set Priorities for Actions?
Setting priorities for actions is also simple, at this point. Simply sort the spreadsheet on the BP Percent column in descending order. That way, the items with the greatest percent of buffer penetration get the supply chain managers’ attention first. These are the items that required the most immediate attention.
Actions should be taken by working down the list through all the red-coded items, starting with items with 100 percent BP and ending with items with BPs at or near 67 percent.
In our next article, we will discuss how buffer sizes are dynamically managed using the feedback on buffer penetration, as well.


