Using Extended Events for Performance Troubleshooting Slow Tasks in Sage 500 Part 1
Identifying the Sage 500 Task Name as seen in SQL Server
This is part 1 in a series of blog posts on using extended events to performance tune Sage 500. On a SQL Server running under load from hundreds of users, integrations and jobs, the number of batch requests per second can be in the thousands. Trying to trace specific activity needs to be filtered. There are several common ways to filter this activity. When a tuner is working with a specific user, the XE session can be filtered to only capture events for that user. However, many times performance needs to be recorded throughout the day as it may be slow at unexpected times or it may be difficult to coordinate a work session between the tuner and the user.
To setup an unattended XE session, I filter by the Sage 500 task name. This has to be the task name as seen by SQL Server, not the caption shown on the user’s screen.
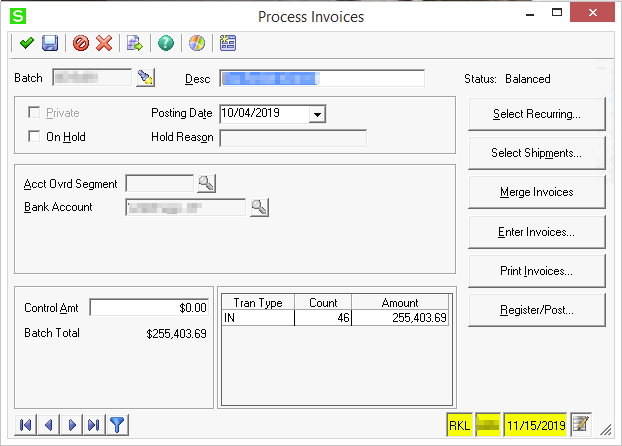
First open the screen in the Sage 500 Client

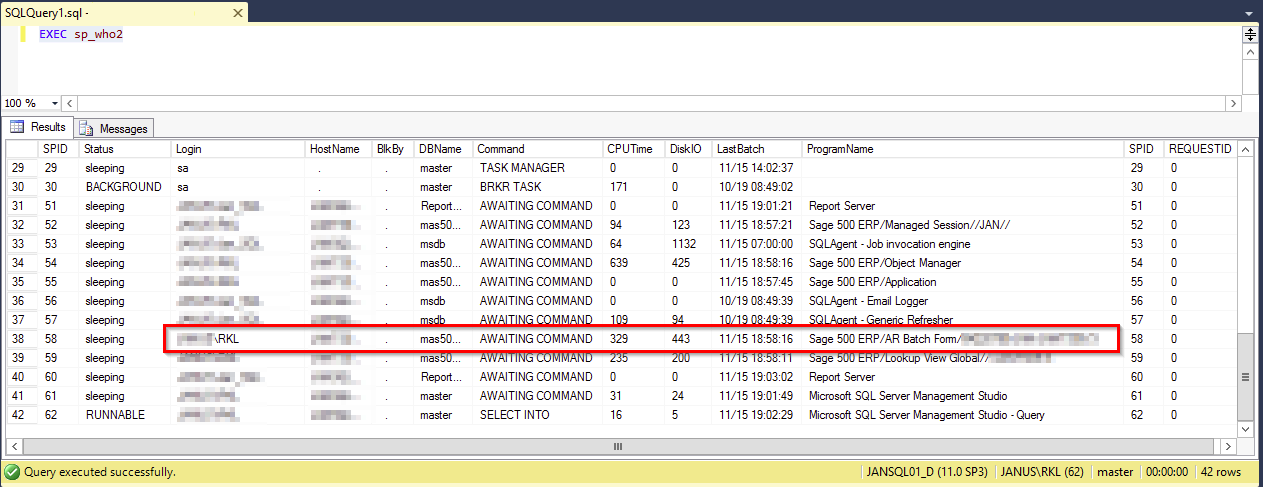
Then open SQL Management Studio and run the sp_who2 stored procedure.

In this list find the user and the Program Name. In this example for Process Invoices, SQL Server sees the Program Name as Sage 500 ERP/AR Batch Form/ I will use this as I setup the extended event session to trace this activity.
More in this Troubleshooting series
Parsing an Extended Event Attach_Activity_ID into Component Parts with the String_Split Function
Using Extended Events to Performance Tune Sage 500 - Overview
IDENTIFYING THE SAGE 500 TASK NAME AS SEEN IN SQL SERVER
CREATE AN EXTENDED EVENTS SESSION FOR RECORDING ALL THE ACTIVITY UNDER A TASK
Running the XE Session and Brief View of Events
EXTRACT THE XE DATA FROM THE EVENT FILE AND LOAD IT INTO A SQL TABLE
ADD HELPER COLUMNS TO THE XE TABLE
ANALYZE THE DATA FOR LONG-RUNNING SINGLE QUERIES
ANALYZE THE DATA FOR QUERIES THAT AGGREGATE TO LARGE IMPACT
GOT QUESTIONS ABOUT Sage 500 ERP?
Contact us if you have more questions about your Sage 500 solution >> Contact RKL eSolutions