Some years ago, Ian Glenday was working with a team analyzing product sales by country for a Fortune 500 company. While he--and we--are generally familiar with the old 80/20 rule, which says that 80 percent of revenues will come from 20 percent of the products (or customers, or whatever), as Glenday and his team repeated their analysis across country after country, they noticed a far more significant pattern starting to emerge.
Here's what they found ...

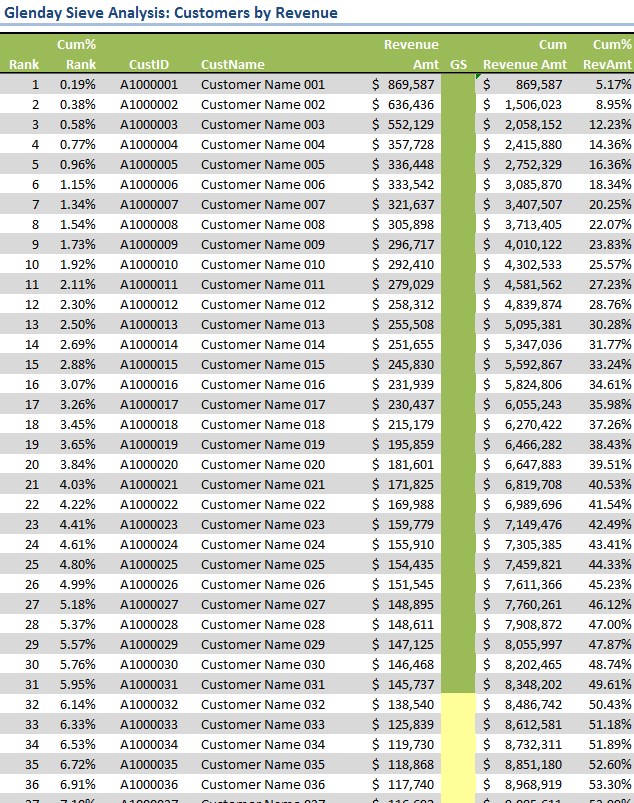
Glenday Sieve - Customers by Revenue (actual example)
6% of the Products Account for Half the Sales
Time after time, they discovered amazingly that six percent (6%) of the products accounted for half--that's right, 50 percent--of the sales. Almost equally amazing was the discovery that 95 percent of sales were produced by 50 percent of the SKUs (products). Of course, that meant that the other 50 percent of sales were scattered hither and thither across the remaining five percent (5%) of SKUs. This analysis became known as the Glenday Sieve.
You can read more about this discovery here: Glenday, Ian, and Ricky L. Sather. Lean RFS (Repetitive Flexible Supply): Putting the Pieces Together. Boca Raton: CRC, 2014. Print.
A few months ago, I wrote about applying the Glenday Sieve in managing production and your supply chain. In the article, I would like to point out how our clients might benefit applying the Glenday Sieve for segmenting their market.
The illustration above (names have been changed to protect privacy) is a Glenday Sieve analysis of the revenues for a real company. When we discussed this analysis with the firm's management team, we highlighted the fact that this analysis functions merely as a starting place for asking lots of good questions that may help the firm make more money tomorrow than it is making today.
By the way, the result of the Glenday Sieve analysis is to break down products, services, revenue streams, activities (or whatever is being analyzed) into "streams." The six percent leading to the top 50 percent of volume is called the "Green" stream. The next ~44 percent of that adds 45 percent of the volume (to the 95 percent cumulative level) is referred to as the "Yellow" stream. In many cases, the last five percent (5%) of business volume is distributed across the remaining 50 percent of SKUs, products, customers or whatever aspect is being "sieved," and is referred to as the "Red" stream. (In some cases, the "Red" stream is further segmented. In the accompanying figure, the "sieve" was being run by SKU. In our case above, however, we are doing the analysis of activity based on revenues.)
Questions to Consider in Glenday Sieve Analysis
Here are some questions that might come quickly to mind when we look at the Glenday Sieve analysis of revenues by customer:
- Should we be managing the GREEN stream homogeneously with the rest of the customer base? Or, does the consistency of the GREEN stream justify its own dedicated resources? In other words, is GREEN stream production really "one kind of factory" and production for the far more volatile (in terms of percent of change) YELLOW and RED streams "another kind of factory" altogether?
- Should our approach to marketing and sales be different for each of these streams?
- What do we know about customers in the YELLOW or RED streams that we can leverage to help move them from the YELLOW or RED streams and into the GREEN stream (which is much easier to manage and is likely producing the bulk of our profits)?
- What else do we know--probably, "tribal knowledge"--about customers in our GREEN stream that we can leverage to help make them even more profitable and yet happier customers than they are today? What can we do to make them "customers for life"?
- What kinds of activities do we engage in most frequently with our GREEN stream customers? How can we improve our approach to execution with these customers in order to create impeccable customer service or slash away at lead-times for them? (Such analysis will not only help us improve and accelerate service to the GREEN stream, but these improvement will simultaneously lead to increases in capacity without adding new resources so that, as we move more customers from the YELLOW stream into the GREEN stream, we can do so without increasing our overhead expenses.)
- What are our GREEN stream vulnerabilities? Are there existing GREEN stream customers that are likely to fall out of the GREEN stream in the near future? If so, why? What can be done to keep them in the GREEN stream or replace their GREEN stream revenues in the future?
- For existing GREEN stream customers ask:* What was their condition when we were first introduced to them?
* What have we done to help them improve overall?
* What can we learn from our experience with these customers that might help us with other clients or to open new markets?
Conclusion
We are certain that there are plenty of other good questions that a close review of a Glenday Sieve of various aspects of your company or supply chain might trigger. But the questions will vary by industry and even your firm's specific circumstances. Those given above are just intended to examples and far, far from an exhaustive list of such questions.
We would like to have your feedback on this important matter. Please leave your comments below, or feel free to contact us directly, if you would prefer.