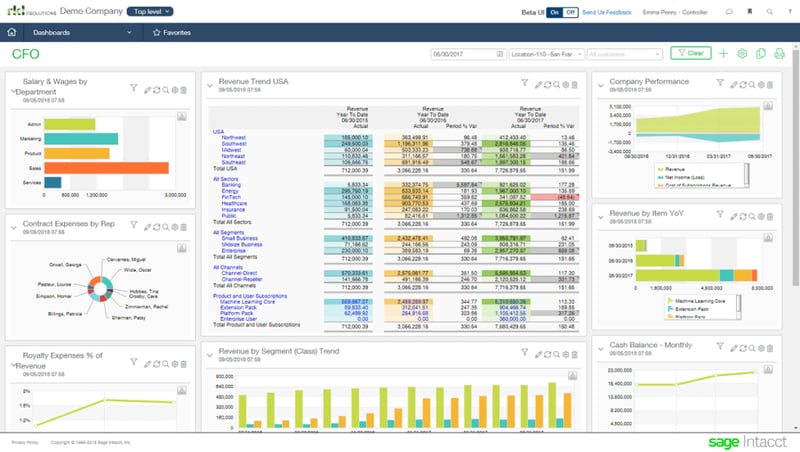
Financial dashboards are a game-changer for finance executives, providing them with a bird's eye view of their entire organization at a glance. Instead of spending hours sifting through mountains of data, financial dashboards offer a quick synopsis of key performance metrics, allowing finance professionals to focus on strategic decision-making. With Sage Intacct's CFO dashboard, financial executives can rest assured that they have instant access to the most critical views of their organization, including cash flow details by entity, revenue trends by region, salary and wages by department, and more. These dynamic dashboards offer real-time visibility into what's going on in an organization, empowering finance professionals to identify red flags, make informed decisions, and drive growth.
The Sage Intacct CFO dashboard gives executives critical views of how the company is performing. Examples include:
- Continuous roll-up functionality
- Ability to view a variety of charts at once
- Cash flow detail by entity
- Revenue trend by region
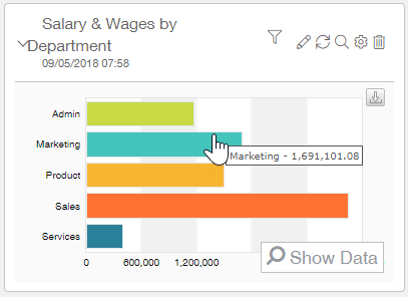
- Salary and wages by department
- Royalty expenses
- Current Cash balances
- And more!
➥ Also Read 10 Critical Dashboard Metrics Every CFO Should Have Access To.

Sage Intacct’s dashboards aren't just static representations of data; they’re dynamic and to give you up-to-date real time visibility into what's going on in an organization. For example, a CFO may want to understand more, not just about what's happening on a corporate level but also in a specific location or a Controller may need to understand why expenses of going up year over year. Sage Intacct’s dashboards allow users to filter data using customizable dimensions for locations, projects, entities and more and to drill down into specific data all the way to the transaction level. This allows finance professionals to get a comprehensive view of the data points in their organization, identify red flags and use that information to drive strategic decisions.